
Solutions · Continuous analytics
Intelligent Digital Attribution
Faster, more detailed marketing measurement
Modern measurement combines rapid-read digital analytics with comprehensive econometric modeling, delivering granular campaign visibility without losing holistic commercial context.
Intelligent Digital Attribution (IDA) operates alongside full marketing mix modeling to bridge operational campaign optimization and executive-level budget planning. This two-tier architecture uses machine learning priors from rapid digital reads to inform strategic mix simulations.
- Rapid reads5 weeks
- Turnaround measured from ad execution date
- Cadence2–3 months
- Ongoing digital performance updates
- GranularityTactical
- By placement, format, and objective
01Industry challenge
Traditional MMM Can Leave Planners Waiting
The latency gap
Reporting delivered 3–9 months after execution
Annual and semi-annual reporting cadences prevent media teams from validating creative refreshes, channel tests, and in-quarter bid adjustments.
The granularity gap
Missing format, audience, and placement detail
Traditional mix models aggregate investments into macro buckets such as general “Paid Social” or “Online Video.” However, day-to-day media planners require granular insight into specific variables:
- Creative Formats
- Evaluating short-form video versus static display and interactive units
- Targeting Strategy
- Measuring first-party custom audiences against contextual prospecting
- Buying Objectives
- Differentiating reach and brand awareness buys from conversion bidding
- Flighting Controls
- Establishing optimal frequency caps to maximize effectiveness and minimize waste
02The solution framework
Four Keys to Delivering Faster Detail
01
Direct Connections
Daily and weekly ingestion pipeline
02
Machine Learning
High-dimensional shrinkage estimation
03
Electronic Delivery
Self-service exploration and drill-down
04
Two-Tier Cadence
Synchronized operational and executive planning
03Data ecosystem
Data Partnerships Connect Media and Sales
Automated ingestion protocols bridge digital ad impressions, retail media networks, and syndicated sales data across industry partners.
| Partner | Data category | Primary coverage |
|---|---|---|
| Amazon | Media & Sales | DSP impressions, Sponsored Ads, and retail transaction data |
| Media | Search, YouTube, and Display Network campaign metadata | |
| Meta | Media | Instagram and Facebook placement, objective, and reach metrics |
| TikTok | Media | In-feed video, Spark Ads, and auction delivery metrics |
| Pinterest & Snap | Media | Visual discovery and vertical video campaign delivery |
| The Trade Desk | Media | Programmatic display, CTV, and omnichannel impression logs |
| NielsenIQ | Sales | Omnichannel retail scanner and syndicated sales volume |
Data ingestion includes direct platform feeds and co-funded integration relationships designed to streamline media agency authorization and retail measurement.
04Mathematical foundation
Elastic Net Is Built for Many Campaign Variables
Shrinkage across variables vs. products
While empirical Bayes frameworks shrink estimates across products and geographic markets within a single variable, elastic net regularization shrinks coefficients across large sets of correlated campaign variables.
By blending LASSO (L1 norm) and Ridge (L2 norm) penalties, elastic net selects informative predictors while retaining stability among collinear media variables:
minβ ( ‖y − Xβ‖22 + λ1‖β‖1 + λ2‖β‖22 )
Where λ1‖β‖1 performs LASSO variable selection and λ2‖β‖22 provides Ridge grouping stabilization.
LASSO penalty (L1)
Feature Selection
Ridge penalty (L2)
Collinearity Control
Hybrid result
High-Dimensional Stability
05Dual cadence
Rapid Digital Reads Feed a Broader MMM
| 1 → 2 | Tier 1 · Rapid digital reads | Tier 2 · Comprehensive MMM |
|---|---|---|
| Model | Intelligent Digital Attribution (IDA) | Full Marketing Mix Modeling |
| Purpose | Delivers tactical, granular performance reads on digital channels to support near-term media optimization. | Evaluates total commercial drivers across baseline sales, price elasticity, distribution, offline media, and digital channels. |
| Delivery Speed | Results available approximately five weeks after an ad runs | Results delivered at approximately ten weeks after execution |
| Update Frequency | Refreshed every 2–3 months for ongoing campaign steering | Executed once or twice per year for strategic planning |
| Granularity | Deep breakdown across creative formats, targeting audiences, placements, and bid types | High-level digital and offline media buckets combined with commercial drivers |
| Scope | Isolates detailed digital media variables using market-level elastic net regression | Uses rapid digital ML priors to anchor and guide digital parameter estimates |
| Turnaround is measured from the date an ad ran, not from the date of final data receipt. | Feeds long-term scenario planning, cross-channel budget reallocations, and margin optimization. |
06Business intelligence
Explore Results in Drivers or Your BI Tool
Self-service exploration allows stakeholders to inspect the underlying mechanics of commercial growth.
Measurement findings are published directly to interactive interfaces, enabling marketing and finance teams to:
- Analyze YoY Growth
- Deconstruct overall sales change into baseline, macroeconomic trends, and media contribution
- Multi-Dimensional Drill-Down
- Filter outcomes by execution period, product hierarchy, brand, and retail account
- Media vs. Volume Correlation
- Inspect weekly impression delivery against incremental sales spikes
- ROI Decomposition
- Unpack overall return into pure media effectiveness versus negotiated unit cost
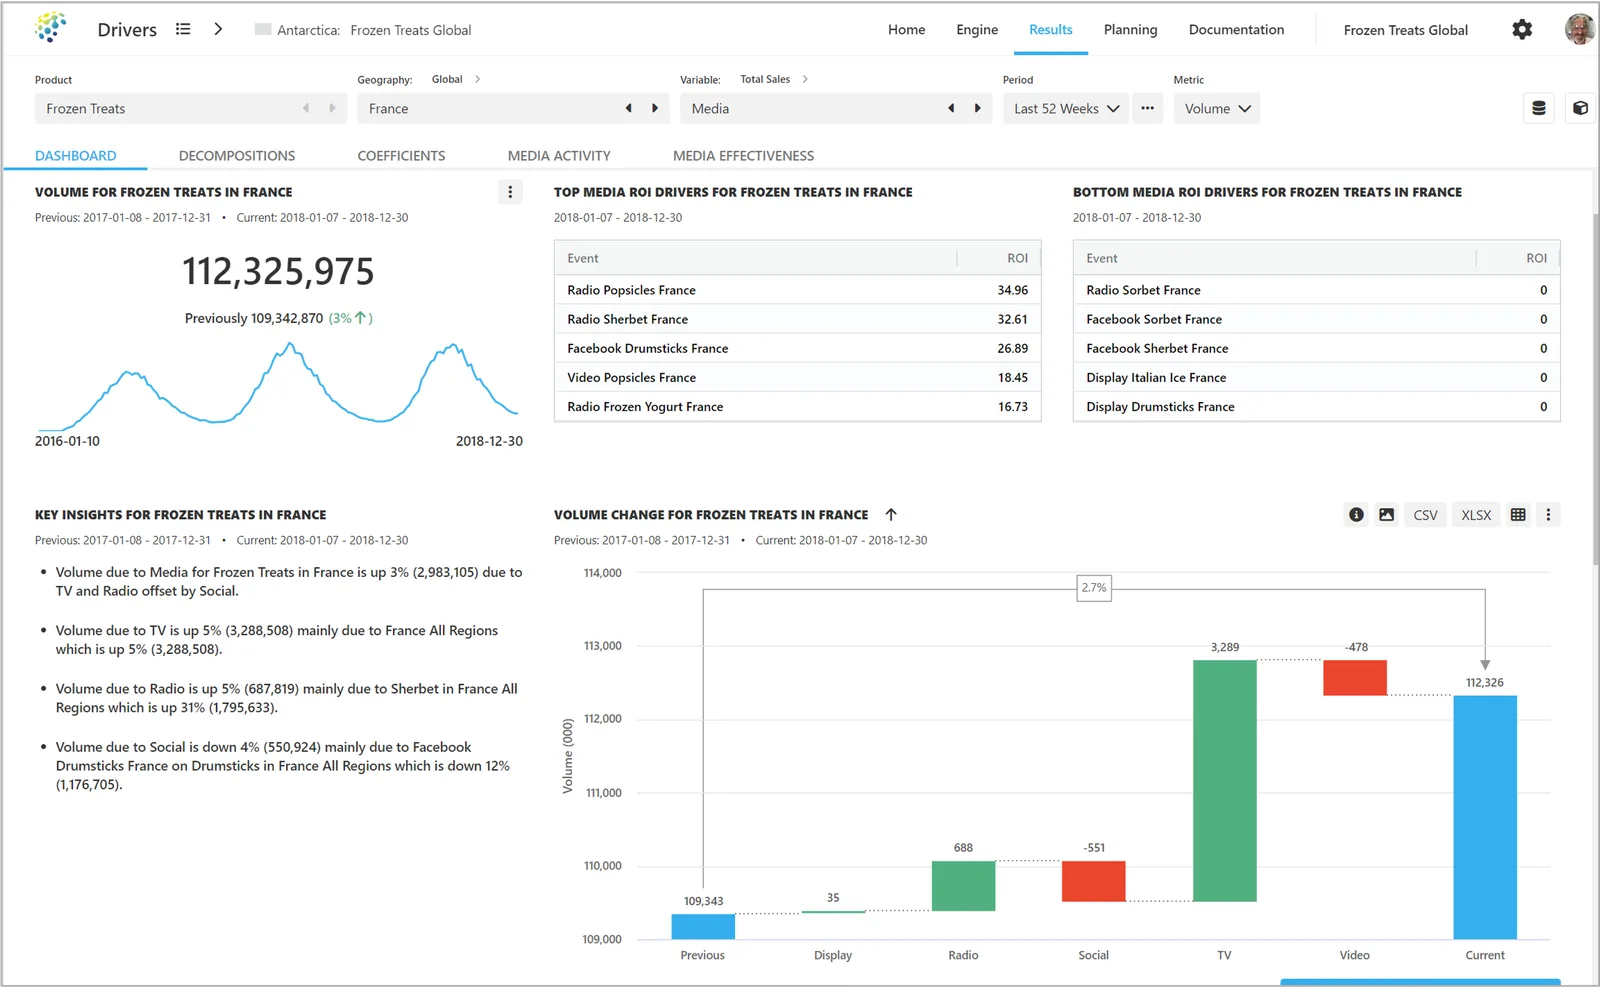
Interactive Drivers reporting interface showing incremental volume breakdown, weekly execution, and account-level drill-downs
07Cadence integration
A Recurring Calendar Supports Planning
Interleaving fast digital updates with periodic full mix modeling creates a rhythm that aligns with financial planning cycles.
In this workflow, continuous digital reads keep campaign tactics tuned while establishing empirical priors. Periodic full MMM updates incorporate pricing, distribution, trade promotions, and offline media to power forward-looking scenario optimizers.
The timeline shown reflects an illustrative historical operating cadence from source documentation, demonstrating how rapid digital updates and full MMM runs interlock across four consecutive quarters.
Illustrative annual measurement cadence: interleaving rapid digital reads with strategic full MMM runs and scenario budget simulation